Tue Mar 05 2024 | 5 min read
INTERESTING WAYS TO STUDY CLIMATE CHANGE
Author

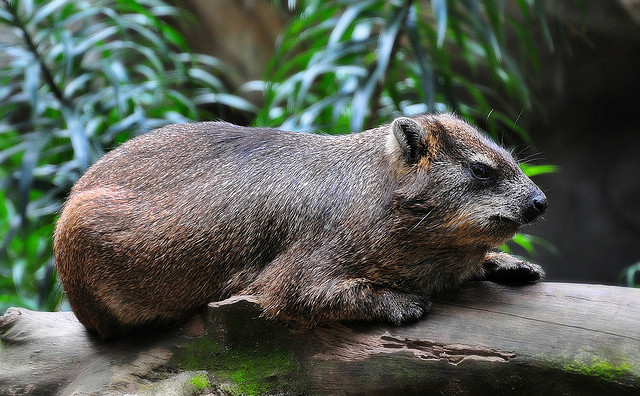
Fossilized Hyrax Urine
Douglas-firs and Geoducks
”Strange bedfellows” is what scientists labeled the unusual partnership of the Douglas-fir and the geoduck in building accurate climatic measurements. The geoduck is the Pacific Northwest’s largest bivalve while the Douglas-fir is known to be an iconic tree in the area. These two radically different species have one thing in common that help researchers establish accurate cimatic measurement patterns: growth rings.
Tree rings from the Douglas-fir reflect climatic conditions that influence growth during particular time periods. However, when these are paired with a second, different species the reliability of the data is understandably boosted. In an article published by theOregon State University, dendrochonologist Bryan Black explains how applying tree-ring techniques to marine species increases data reliability.
“When we associate rings from one species with known sea surface temperatures, we can account for almost 50 percent of the variability in the instrument records. But when we add the data from a second species, we can increase that number to 70 percent or more. And that’s important because it is allowing us to go back and create more accurate models of sea surface temperatures and at time scales more than twice the length of the instrument measurements.”
“Each species brings its own ‘perspective’ of past climate, such that their combination provides a more accurate account,” he said.
Coral Cities
Coral polyps may be one of the tiniest animals on Earth, but their colonies are responsible for the largest biologically built structures on the planet. Millions of these tiny creatures build coral cities underwater by using calcium carbonate extracted from warm, tropical ocean waters. Calcium carbonate is the same substance found in bones, teeth, and shells. As with tree rings and mollusk shells, layers of coral skeleton tell stories about the climatic and environmental conditions during the time it was built. Studying these coral cores is the essence of coral paleontology.
Scientists extract cores from these long-lived coral cities on diving expeditions. NOAAexplains that for scientists to get an ideal core, they need to drill from the surface directly towards the center. By following a coral’s plane of maximum growth scientists can acquire a sample with as many rings as possible. They then X-ray the samples to study climate fluctuations recorded in the coral over the years.
Google Earth Timelapse
If anybody ever wanted to paint a picture of climate change,Google’s Timelapsecomes close to providing a picture that speaks a thousand words. The Timelapse project is the result of Google’s partnership with Time, NASA, and the U.S. Geological Survey (USGS). Timelapse boils down a quarter of century’s worth of Landsat satellite data into zoomable time-lapse maps. Timelapse focuses on strategic locations for the best impact, such as Las Vegas, the Amazon, and Dubai.
Each Timelapse image lasts only a few seconds, but it shows how much the the area has changed in the last 25 years. Sometimes the visual changes are shocking, such as the dramatic retreat of the Columbia Glacier or the drying of the Aral Sea; sometimes the images are more thought-provoking than surprising. The transformation of the dark green brush of the Amazon into bare patches fringing a green core (shown above) testifies to the relentless demand on forests that humans make. Visually compelling, these images tell an eloquent story about civilization, climate change, and a changing planet.
What do you think of the ways climate change is affecting our planet and how it is being measured by modern science? Let us know in the comments below
Related Blogs
Add your comment here

ADDRESS
Zero Carbon One
WY 82801, United States.
New Delhi - 110016, India. Noida - 201 301, India.


© 2026 — Copyright ZeroCarbon One
Zero Carbon One LLC
Zero Decarbon One Pvt. Ltd.


